Visual Cortex: A Schematic Map October 22, 2007
Posted by Johan in Neuroscience, Sensation and Perception, Social Neuroscience.trackback
I came across this figure in a review by Grill-Spector and Malach (2004). It condenses an already-dense 40-page review into a single figure, so I would have to write a post of similar length to explain it entirely in laymen’s terms. This may be one post to skip if you haven’t the slightest idea of visual perception.
Even if you know your vision, this figure isn’t entirely straightforward. Still, I think it serves as a useful reference for those dense vision papers. With one or two notable exceptions, vision scientists insist on ridiculous naming conventions (the motion sensitive area hMT+ being the case in point), so this might help you remember the plot.
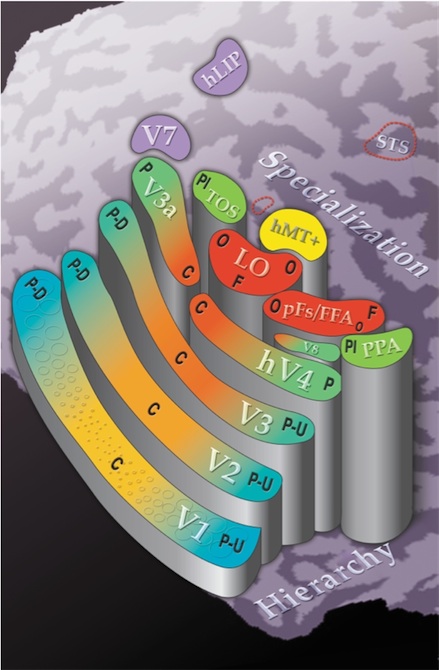
This map is only schematic. However, it represents the rough relationships, as they stood in 2004. The areas are mapped onto the right hemisphere occipital lobe, which has been flattened so that the dark areas represent sulcii (grooves), and the light gyrii. The posterior-anterior axis is sort of bottom-left to top-right, so V1 is (predictably) at the very back of the brain, while the Parahippocampal Place Area (PPA) is on the ventral (bottom) side.Height in this picture represents hierarchy in the processing, as Grill-Spector conceives of it. In other words, the first area is V1, and then we move up the stairs to V2, V3, and so on.
The colours code specialization. In the early areas (V1-V3), this is represented by central versus peripheral mappings, where the cortical magnification factor ensures that the centre is largest, and the highest acuity. Helpfully, they are labelled P-D (down) for the superior end of each map, and P-U (up) for the ventral end (your retinal image of the world is upside down, and apparently the visual system has no need to reverse this representation in later areas).
In later areas, the areas are filled in with one colour, presumably for simplicity – Grill-Spector actually believes that these have some retinotopic organisation as well. The colours still reflect specialization though – we can see that areas such as the Fusiform Face Area (FFA) and the Lateral Occipital complex (LO) are based on central, high-acuity representations, while other areas such as the PPA are based on more peripheral, lower-resolution representations. The letters that are strewn over the areas are meant to approximate locations of sensitivity to certain object categories: places (Pl), objects (O), and faces (F).
Do note that the Superior Temporal Sulcus (STS) is treated as somewhat of a black sheep, placed out in the corner with no colouring or height. This is probably because it is relatively poorly understood. The STS responds to biological motion, such a Johansson figures (see a demo), but its activation also appears to be strongly modulated by the social significance of the stimulus. For instance, Pelphrey et al (2005) found that the STS response in normal controls was greater when a face looked away from an obvious object rather than when gaze was directed towards it, which suggests that the STS does more than merely detect biological motion. Interestingly, people with Autism failed to show the same modulation by expectation in the STS.
The poor understanding of the STS is in part because it responds so specifically to biological motion, which makes conventional retinotopy techniques impossible. Also, I suspect there is a deep-rooted fear in some vision scientists of anything that starts with “Social.”
Another thing to note is the chasm between the last V area and the STS. Presumably, the intermittent areas are also involved in vision, but we don’t know much about what they do yet.
References
Grill-Spector, K, and Malach, R. (2004). The Human Visual Cortex. Annual Review of Neuroscience, 27, 649-677.
Pelphrey, K.A., Morris, J.P., and McCarthy, G. (2005). Neural Basis of Eye Gaze Processing Deficits in Autism. Brain, 128, 1038-1048.

[…] Rather than relaying a static range of visual information at all times (in the manner of, say, a monitor or television screen), the human eye makes at least three saccades per second, spending the majority of neural resources on the most high-contrast information it receives – such as movement, color, or edges. This information is passed through several neural layers to the retinal ganglion cells, which synapse at the optic nerve. This X-shaped nerve consists of over 1.5 million fibers (axons of individual neurons) which transmit signals to an area of the thalamus known as the lateral geniculate nucleus (LGN). The LGN contains layers of several types of specialized neurons, each corresponding to a specific type of photoreceptor. These cells, in turn, synapse in the visual cortex. […]