Domain specificity follows from interactions between overlapping maps March 10, 2008
Posted by Johan in Face Perception, Neuroscience, Sensation and Perception, Theory.1 comment so far

![]() I can’t simplify the title beyond that, but don’t run away yet, the idea itself is straight forward once the terminology is explained. Skip ahead two paragraphs if you know what domain specificity means.
I can’t simplify the title beyond that, but don’t run away yet, the idea itself is straight forward once the terminology is explained. Skip ahead two paragraphs if you know what domain specificity means.
Recognition of objects in the visual scene is thought to arise in inferior temporal and occipital cortex, along the ventral stream (see also this planned Scholarpedia article on the topic by Ungerleider and Pessoa – might be worth waiting for). That general notion is pretty much where consensus ends, with the issue of how different object categories are represented remaining controversial. Currently, the dominant paradigm is that of Nancy Kanwisher and colleagues, who hold that a number of domain-specific (that is, modular) areas exist, which each deal with the recognition of one particular object category. The most widely accepted among these are the fusiform face area (FFA), the parahippocampal place area (PPA), the occipital face area (OFA), the extrastriate body area (EBA), and the lateral occipital complex (LO), which is a bit of a catch-all region for the recognition of any object category that doesn’t fall into one of the domains with their own area. Usually, the face-selective part of the superior temporal sulcus (STS) is also included.
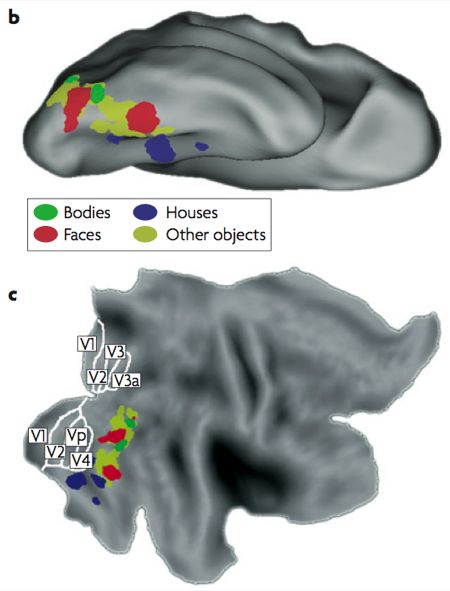
Typical locations of object areas by category. B is an upside down down, C is flattened
This modular view of the visual recognition has received a lot of criticism. However, the undeniable success of the functional localiser approach to fMRI analysis, in which responses are averaged across all voxels in each of the previously-mentioned areas, has led to widespread acceptance of the approach. Essentially, then, the domain specific account seems to be accepted because recording from a functionally-defined FFA, for instance, seems to yield results that make a lot of sense for face perception.
When you think about it, the domain specific account in itself is a pretty lousy theory of object recognition. It does map object categories onto cortex, but it is considerably more difficult to explain how such a specific representation might be built on input from earlier, non-object specific visual areas. This brings us to today’s paper, which proposes a possible solution (op de Beeck et al, 2008). The bulk of the paper is a review of previous research in this area, so give it a read for that reason if you want to get up to speed. The focus of this post is on the theoretical proposal that op de Beeck et al (2008) make towards the end of the paper, which goes something like this:
Ventral stream areas contain a number of overlapped and aligned topographical maps, where each maps encodes one functional property of the stimulus. Op de Beeck et al (2008) suggest that properties might include shape, functional connectivity, process, and eccentricity. Let’s go through each of those suggestions in turn (the following is based on my own ideas – op de Beeck et al don’t really specify how the topography of these featural maps might work):
A shape map might encode continuous variations of for instance angularity and orientation of parts of the stimulus. So one imaginary neuron in this map might be tuned to a sharp corner presented at an upright orientation (see Pasupathy & Connor, 2002 for an example of such tuning in V4), and topographically, the map might be laid out with angularity and curvature as the x and y dimensions in the simplest case.
Functional connectivity is hard to explain – read the article I just linked if you’re curious, but let’s just call it brain connectivity here. A map of brain connectivity is a topographical layout of connections to other areas – for instance, one part of the map might be more connected to earlier visual areas (such as V4), while another part of the map might connect more with higher-order areas that deal with memory or emotion (e.g., hippocampus, amygdala).
The process map is a tip of the hat to some of Kanwisher’s strongest critics, such as Tarr & Gauthier (2000), who argued that the ventral stream isn’t divided by object category, but by the visual processing that is used. So for example, the FFA is actually an area specialised for expert within-category discrimination of objects (faces or otherwise), which happens to appear face-specific because we have more experience with faces than with other categories. Some parts of the map might deal with such expertise discriminations, while others might deal with more general between-category classification.
Eccentricity is a fancy term for distance from the fixation point (ie, the fovea) in retinal coordinates. If you hold your finger slightly left of your fixation point and continue to move it left, you are increasing the eccentricity of the stimulus. Eccentricity and its complicated partner polarity (visual angle) reflect the two basic large-scale topographical principles in early visual areas, but such maps can be found throughout the visual system.
Incidentally, the eccentricity map is the only of these proposed maps for which there is currently good evidence in this part of the brain (Levy et al, 2001). The part that corresponds to the FFA has a foveal (or central) representation of the visual field, which makes sense considering that we tend to look directly at faces. Conversely, the PPA has a peripheral representation, as might be expected since most of us don’t spend much time fixating on the scenery.
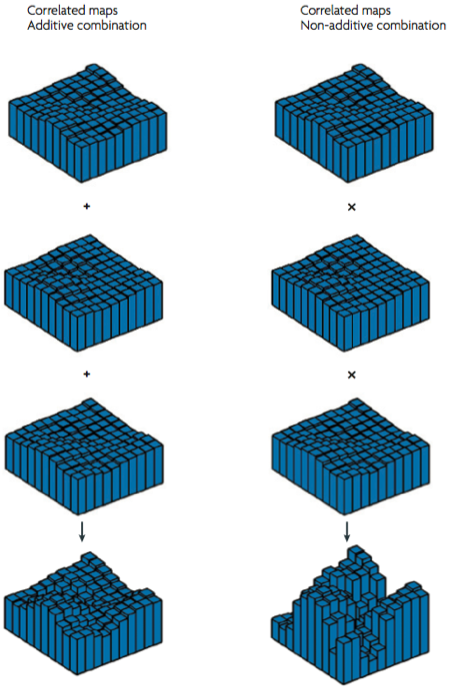
The central proposal is that in an area such as the FFA, the face-specific response is actually the combination of the concurrent, aligned activation of a number of different maps. For example, the FFA might correspond to responses tuned to rounded shapes in the shape map, to input from earlier visual areas in the functional connectivity map, to expert within-category discrimination in the process map, and to a foveal (central) representation in the eccentricity map.
To really get the kind of strong domain-specificity that is observed, these maps must display multiplicative interactions – op de Beeck et al (2008) suggest that if their simultaneous activations were just added to make up the fMRI response, you wouldn’t get the strong selectivity that is observed (so by implication, less strict modularists could do away with the multiplicative bit and get a map that corresponds better to their view of ventral areas).
This is a pretty interesting idea, although wildly speculative. Note that with the exception of eccentricity, there really is very little evidence for this form of organisation. In other words, this theory is a theory not just in the scientific sense, but also in the creationist sense of the word. It definitely is an inspiring source of possible future experiments, however.
References
Levy, I., Hasson, U., Avidan, G., Hendler, T., & Malach, R. (2001). Center-periphery organization of human object areas. Nature Neuroscience, 4, 533-539. DOI: 10.1038/87490
Op de Beeck, H.P., Haushofer, J., Kanwisher, N.G. (2008). Interpreting fMRI data: maps, modules and dimensions. Nature Reviews Neuroscience, 9, 123-135. DOI: 10.1038/nrn2314
Pasupathy, A., & Connor, C.E. (2002) Population coding of shape in area V4. Nature Neuroscience, 5, 1332-1338. Link
Tarr, M.J., & Gauthier, I. (2000). FFA: a flexible fusiform area for subordinate-level visual processing automated by expertise. Nature Neuroscience, 3, 764-769. DOI: 10.1038/77666
Know your neuron: Grid cells March 3, 2008
Posted by Johan in Animals, Know your neuron, Navigation, Neuroscience.3 comments
Know your neuron is a mini-series here at the Fan Club where we look at some of the curious response characteristics of neurons discovered through electrophysiology. We will work our way through the simple properties of cells that respond to spatial locations or head direction and on to increasingly abstract cells, which encode the identity of individuals or perhaps even the relation between actions of others and those of the self.
![]() Given how straight-forward their response properties are, it is curious that grid cells were only discovered relatively recently (Hafting et al, 2005). According to one of my professors, this is simply because researchers didn’t put their rats in sufficiently large boxes to see the pattern previously, but who knows… The response properties of grid cells are perhaps best illustrated in a figure (this is from the excellent Scholarpedia article on Grid cells, written by two of their discoverers).
Given how straight-forward their response properties are, it is curious that grid cells were only discovered relatively recently (Hafting et al, 2005). According to one of my professors, this is simply because researchers didn’t put their rats in sufficiently large boxes to see the pattern previously, but who knows… The response properties of grid cells are perhaps best illustrated in a figure (this is from the excellent Scholarpedia article on Grid cells, written by two of their discoverers).
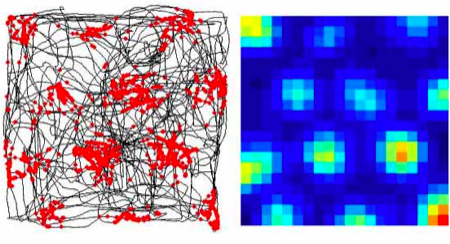
In this figure, the x and y coordinates correspond to the spatial location of a rat, which is running around freely inside a large box. The black lines in the left figure shows how this particular rat explored the box in a fairly haphazard manner. However, an electrode inserted in the rat’s subcortex picks up a signal that is anything but chaotic: the responses of said neuron are given as red dots in the left figure, while the right figure gives the firing rate distribution (ranging from blue for silent and red for the peak rate of responding). Although the rat is running about randomly, this neuron is responding in a grid, seemingly coming on an off in response to the animal’s spatial location.
This response pattern is similar regardless of the exact box, so the pattern does not reflect learning of the spatial layout of this box as such. Indeed, when the light is turned out, the grid cell continues to respond as before while the rat runs around in the dark (Hafting et al, 2005 – this is not terribly impressive when you consider how little rats use vision, however). Yet, at least some grid cells showed a response pattern that rotated 90 degrees with a corresponding shift in an external visual cue, so although the grid cells do not depend on the external environment, they do seem to take cues from it when available.
Grid cells are found in Entorhinal cortex of the rat, a region which provides the main input to the Hippocampus, long known as a centre for memory consolidation and spatial navigation. Thus, these cells are a prime candidate as building blocks for more complex spatial cells that are observed in the Hippocampus proper. Different grid cells in Entorhinal cortex appear to have partially overlapping response fields, so that a given location might produce a response in some grid cells but not others. There is also a topographical structure, where the size of the grid increases as one moves from the dorsomedial to the ventrolateral side of the area. Incidentally, this pattern matches a spatial scale increase of more complex cells in the Hippocampus proper.
The obvious implication is that by combining the output of a number of partially-overlapping grid cells, perhaps a cell with more complex spatial properties could be built. The next issue of Know your neuron is about one category of such neurons, which appear to respond only to a specific spatial location.
References
Hafting, T., Fyhn, M., Molden, S., Moser, M., & Moser, E.I. (2005). Microstructure of a spatial map in the entorhinal cortex. Nature, 436, 801-806. DOI: 10.1038/nature03721
Moser, E., & Moser, M.-B. (2007). Grid Cells. Scholarpedia, 2, 3394.
You’ll feel better in the morning: Sleep deprivation disconnects the emotional brain January 27, 2008
Posted by Johan in Emotion, Neuroscience, Sleep.3 comments

 Disturbed sleep patterns feature in a range of psychiatric disorders, many of which fall under the DSM’s mood disorder category. A recent paper by Yoo et al (2007) suggests that sleep deprivation itself can produce abnormal affective processing. In other words, sleep disturbances may be a cause as well as a symptom in conditions such as depression.
Yoo et al (2007) approached this issue with fMRI. Brain scans were taken of one participant group who had been sleep deprived for 35 hours, and one group who had slept normally. The participants viewed emotional pictures from a standardised set (the international affective picture system), which varied gradually in valence from neutral to aversive.
Yoo et al approached the imaging analysis with a few theoretical notions, which formed the basis of the brain areas that they investigated more closely. First, the amygdala is believed to mediate the emotional response to the aversive pictures, and secondly, it is argued that responding in the amygdala is mediated by an inhibitory projection from medial prefrontal cortex (a frequently invoked projection – see this related post).
To address the first issue, Yoo et al compared the amygdala response to the aversive pictures in the two groups. The amygdala was more activated bilaterally in the sleep-deprived group, and furthermore, a larger volume of amygdala was activated in this group as the figure at the top of this post shows. Note that the neutral pictures elicited no greater amygdala responses in the sleep-deprived group, so this is a case of greater amygdala re-activity, rather than an increase in baseline responding.
The role of medial prefrontal cortex in mediating the amygdala reactivity was investigated by measuring the regions that showed functional connectivity with the amygdala during the task. The method isn’t straightforward, but essentially it’s based on taking the activity in the amygdala voxels, and assessing which other brain regions show responses that covary. The results are given as a contrast between the two groups.
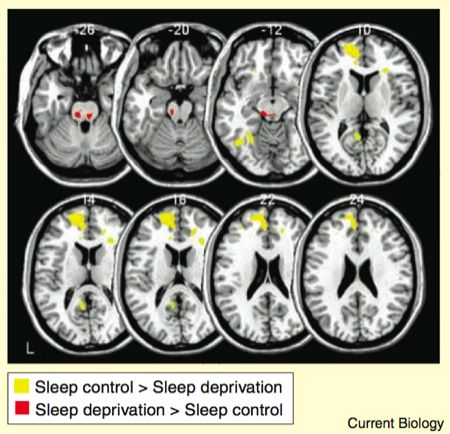
As the yellow bits in the figure show, the sleep control group displayed stronger amygdala-prefrontal connectivity than the sleep-deprived group. Conversely, the amygdala had stronger connectivity with various regions of the brainstem in the sleep deprived group compared to the sleep control group.
So to re-cap: sleep-deprived participants showed larger amygdala responses, and their amygdalas showed weaker functional connectivity with medial prefrontal cortex. This finding does not prove that the greater amygdala response in the sleep-deprived group was caused by the weakened connectivity with medial prefrontal cortex, but it is certainly consistent with that notion. Yoo et al suggest that sleep acts as a kind of reset of brain reactivity, to ensure that emotional challenges can be met appropriately. But why is such a reset necessary in the first place? Why is the regulatory influence of medial prefrontal cortex weakened by sleep deprivation? The role of sleep in affect is only beginning to be understood.
References
Yoo, S-S., Gujar, N., Hu, P., Jolesz, F.A., & Walker, M.P. (2007). The human emotional brain without sleep – a prefrontal amygdala disconnect. Current Biology, 17, 877-878.
Discriminating individual faces from neural activation December 29, 2007
Posted by Johan in Face Perception, Neuroscience.2 comments

![]() How do we recognise faces? The vast majority of research into face perception has attempted to answer this question by restricting their investigations to a small section of the fusiform gyrus, which Kanwisher and colleagues named the Fusiform Face Area (FFA) in 1997. It is commonly proposed that the FFA handles not only the detection but also the recognition of individual faces. A recent paper by Kriegeskorte et al (2007) suggests that instead, a region in the right anterior inferotemporal cortex (aIT – ahead of and above the FFA) encodes information about different faces, while the FFA does not. In order to understand the finer points of this finding, it is necessary to explain the basic assumptions of univariate neuroimaging analysis, and how it is used to identify the FFA. Skip ahead a paragraph if this is familiar territory.
How do we recognise faces? The vast majority of research into face perception has attempted to answer this question by restricting their investigations to a small section of the fusiform gyrus, which Kanwisher and colleagues named the Fusiform Face Area (FFA) in 1997. It is commonly proposed that the FFA handles not only the detection but also the recognition of individual faces. A recent paper by Kriegeskorte et al (2007) suggests that instead, a region in the right anterior inferotemporal cortex (aIT – ahead of and above the FFA) encodes information about different faces, while the FFA does not. In order to understand the finer points of this finding, it is necessary to explain the basic assumptions of univariate neuroimaging analysis, and how it is used to identify the FFA. Skip ahead a paragraph if this is familiar territory.
The classic fMRI or PET analysis consists of taking an experimental condition and a control condition, and asking “which areas respond significantly more to the experimental condition than the control?” The resulting activations can be said to constitute areas that are specifically implicated in the experimental condition. For example, the FFA is usually defined as the part of the fusiform gyrus that responds more to faces than to houses. Note that there is an element of inference or assumption involved in then concluding that this bit of brain is the bit that does faces, since other areas might also respond to faces without being detected in a relatively insensitive univariate whole-brain analysis. The common acceptance of this type of contrast analysis stems in part from its practical utility. For example, the FFA corresponds closely to the critical lesion site that causes prosopagnosia (an inability to recognise faces), and activation in this area can be correlated with behavioural performance at various face recognition tasks.
In this study, contrasts were used to identify the FFA in each participant, in addition to a region in the aIT that also responded more to faces than to objects. To do this, Kriegeskorte et al (2007) used only four stimuli, as shown below.

Although contrasting faces and houses revealed the previously mentioned activations in the FFA and aIT, contrasting the two different faces produced no activations.
Kriegeskorte et al (2007) next used a type of pattern analysis, where the FFA and aIT voxels were used as input. The specifics of this type of analysis are too complex to discuss in detail here (see this review by Norman et al, 2006 which concerns a related technique, and a previous post), but essentially, this analysis uses multivariate statistics to assess whether the overall pattern of activation in an area differs significantly between conditions. If it does, it can be inferred that the area processes information about the categories. Pattern analyses are far more sensitive than traditional contrasts when it comes to differences within a region, but they achieve this sensitivity by sacrificing spatial localisation. Kriegeskorte et al (2007) used a range of pattern analyses, but their results are nicely summarised by the analysis depicted in this figure.

In this analysis, Kriegeskorte et al (2007) attempted to discriminate between the two faces based on an increasing number of voxels, expanding from the FFA and aIT regions that were revealed by the contrast. The lines on the y-axis show whether the patterns evoked by the two faces are significantly different in the voxels. Only the voxels in the right aIT respond significantly differently to the two faces, and this difference becomes significant early, when around 200 voxels are included. By contrast, even when 4000 voxels around the FFA are included, encompassing much of the temporal and occipital lobes, the activation here cannot discriminate between the two faces.
So to summarise, both the FFA and the aIT (among other areas) respond more to faces than to houses, but only the aITS responds differentially to specific faces. Although these results lend themselves to the conclusion that the FFA does some type of face detection while the aITS is involved in encoding the identity of faces, Kriegeskorte et al (2007) suggest that it probably isn’t that simple. Previous studies have found identity-specific activations in the FFA using other paradigms (e.g., Rotshtein et al, 2005), so Kriegeskorte et al (2007) go for the classic neuroimaging cop-out of suggesting that identity information nevertheless exists in the FFA, but at a resolution beyond that of current scanners. However, note that the fact that the identity effects in the aIT were detectable suggests that this area might play a larger role in this task than the FFA does, at least. Kriegeskorte et al (2007) note that prosopagnosia may be caused by lesions to the FFA region, but also by aIT lesions, and suggest that face recognition depends on interactions between (among others) these two areas.
From a more methodological standpoint, it is interesting to note that although a contrast between the two faces yielded no significant effects, differences appeared in a pattern analysis. This is a nice example of how pattern analysis may be a more sensitive measure.
The aIT has not received a great deal of attention previously as a face recognition region, so Kriegeskorte et al (2007) are probably going to face close scrutiny, as they have essentially posited that the region plays a leading role in the holy grail of face perception – the recognition of individual faces. It is interesting to note, however, that these findings do offer a means of reconciling fMRI results from humans with data from single-cell recording studies in monkeys, which have revealed identity-specific face responses primarily in anterior temporal regions. Such monkey regions correspond far better to the aIT than the FFA, which has been somewhat of a problem for the conventional account of the FFA as a Swiss army knife of face perception (but see Tsao et al, 2006 for evidence of a better monkey homologue of the FFA).
Really though, the most striking thing about this study is that current neuroimaging technique enables us to discriminate between the neural representation of these two faces. When you look at the faces above, it is clear that physically, they are quite similar. It is quite inspiring to think that it is nevertheless possible to pick out these undoubtedly subtle differences in the evoked neural response pattern.
References
Kriegeskorte, N., Formisano, E., Sorger, B., and Goebel, R. (2007). Individual faces elicit distinct response patterns in human anterior temporal cortex. Proceedings of the National Academy of Sciences (USA), 104, 20600-20605.
Encephalon #37 is out December 3, 2007
Posted by Johan in Links, Neuroscience.add a comment
The latest issue of neuroscience blogging carnival Encephalon has just been posted by Bora over at Blog Around The Clock. Lots of interesting stories in a concise write-up.
